The current lifetime risk of heart failure is approximately one in three and the prognosis remains poor.1 The latest UK heart failure audit data reveal inpatient and 1-year mortality rates of 10 % and 27 %, respectively.2
The aetiology of heart failure is diverse, and many patients have several cardiac and non-cardiac pathologies that conspire to cause the syndrome. Currently the most common cause is ischaemic heart disease, but many patients have comorbidities such as hypertension, diabetes mellitus, atrial fibrillation and renal insufficiency.3–7 The identification of heart failure aetiology is crucial as this may guide subsequent decisions regarding treatment strategies such as suitability for specific evidence-based pharmacological and device therapies. Current National Institute for Health and Care Excellence and international guidelines recommend utilising blood tests (B-type natriuretic peptide), ECG and various cardiac imaging modalities to confirm clinical suspicions of a heart failure diagnosis and investigate the underlying cause of the condition.8–10
Cardiovascular magnetic resonance (CMR) has become a gold standard non-invasive test in heart failure due to its unparalleled capability to not only accurately assess cardiac anatomy and function with excellent reproducibility, but also its unique ability to identify specific pathological tissue characteristics that may be diagnostic of the underlying disease process.11 In the past 2 decades there has been a rapid evolution of contrast-enhanced techniques and subsequent increases in their utilisation in clinical practice and heart failure research. This has led to a large prognostic evidence base. CMR is now recommended as the first-line imaging investigation in the current National Institute for Health and Care Excellence,8 European9 and North American10 heart failure guidelines when transthoracic echocardiographic windows are poor or there is diagnostic uncertainly regarding aetiology. In this article, we will review these prognostic studies, concentrating on how CMR tissue characterisation can guide prognosis in heart failure.
Late Gadolinium Enhancement
Normal myocardium, blood and other tissues have specific T1 times (the time taken for longitudinal recovery of magnetisation after a radiofrequency pulse inverts the net polarisation of atoms in the body). T1-weighted images detect differences in these times, giving an intrinsic contrast between the myocardium and surrounding tissues. Late gadolinium enhancement (LGE) CMR is based upon the principle that gadolinium (Gd) – bound to diethylenetriaminepentaacetic acid or DTPA – is excluded from the intracellular compartment but has free distribution in the extracellular space. It dramatically shortens T1 time and gives extrinsic contrast to the tissue in which it resides. In normal myocardium, where the extracellular space is small, Gd rapidly washes in and out of the tissue and so the T1 is relatively preserved. When healthy myocardium is replaced by fibrosis or “scar” tissue, the extracellular space increases yielding a larger volume of distribution for Gd and a delayed wash out. These scar areas appear brighter on T1-weighted imaging compared to healthy myocardium and the scar burden identified using this technique is well validated against histological assessment.12,13 The wealth of data around LGE and its critical prognostic importance in the whole spectrum of cardiac disease is extensively reviewed elsewhere.14–22 Here, we highlight a few issues that are of specific importance to the heart failure population.
Heart Failure Aetiology
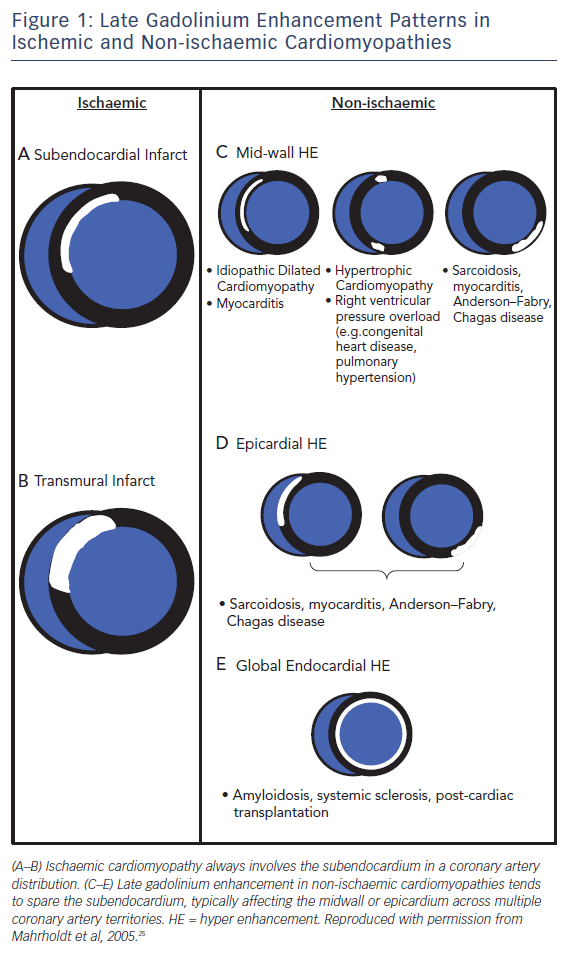
Pathologists have known for decades that disease processes affect the myocardium in specific patterns. LGE CMR allows us to visualise these processes in vivo and identify differentiating and recognisable patterns of scarring,23,24 making LGE CMR a very powerful tool for assessing the aetiology of heart disease, see Figure 1. This is particularly true for ischaemic cardiomyopathy (ICM) versus non-ischaemic cardiomyopathy (NICM).
Early studies26 found that >10 % of heart failure patients labelled with non-ischaemic dilated cardiomyopathy had LGE patterns consistent with previous myocardial infarction. This has since been confirmed in other studies and long-term follow-up highlights the prognostic importance of making this distinction, as patients with ischaemic scarring have been shown to be almost twice as likely to have a cardiac death or heart failure hospitalisation compared to those with non-ischaemic scarring.27
The presence of scarring in any condition seems to confer an adverse prognosis.28 This is reiterated in a recent study of 670 patients with myocarditis followed for up to 7 years. The presence of LGE was associated with double the risk of major adverse cardiac events, with patchy LGE conferring the worst outcome (HR 2.9; CI 1.8–4.8) Septal and midwall patterns were also more strongly predictive of major adverse cardiac events (HR 2.6; CI 1.8–3.8).29 Conversely, the absence of LGE conferred an excellent prognosis, with an annual risk of death of just 0.3 %.
Response to Medical Therapy
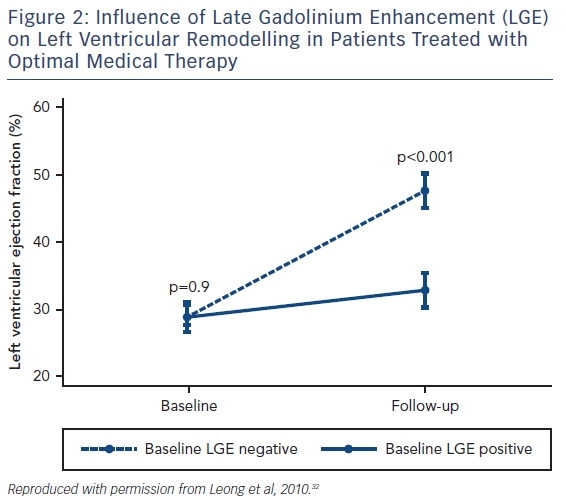
Although various pharmaceutical agents have been shown to improve the prognosis of heart failure, how an individual patient will respond to these medications can vary dramatically and there remains no accurate method of predicting who will benefit from these agents. LGE has shown potential as a CMR biomarker for non-response to first-line medical therapies in heart failure. Patients with both ICM and NICM who have severely impaired systolic function are significantly less likely to have improved left ventricular (LV) function following 6 months of beta-blocker therapy if scarring is identified on CMR.30 Similar observations have been seen in NICM patients with LGE who have received optimal medical therapy, see Figure 2.31,32 Patients with scarring do not respond to medical therapy to the same extent as those without scar tissue.
Response to Cardiac Resynchronisation Therapy
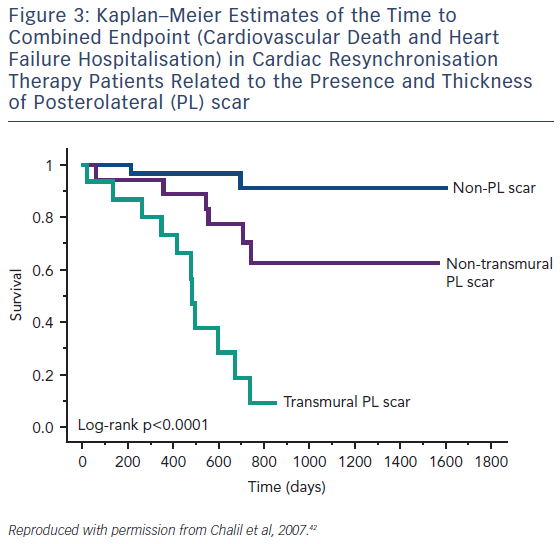
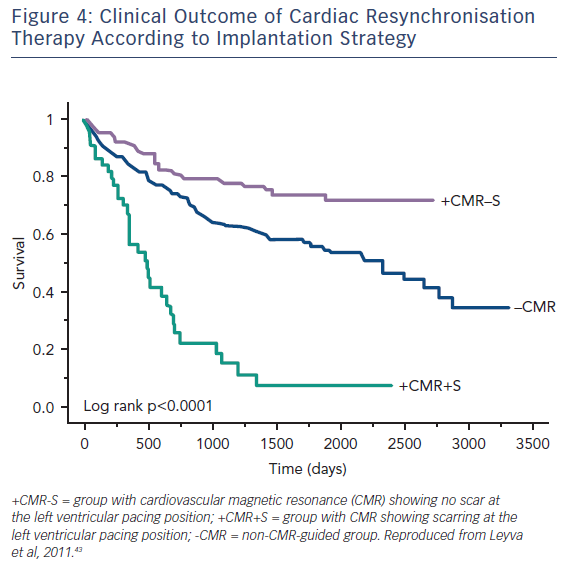
Guideline-directed cardiac resynchronisation therapy (CRT) leads to a significant improvement in quality of life33,34 and a reduction in heart failure hospitalisation35,36 and mortality.37 Despite this, approximately 30 % of these patients gain no prognostic advantage and many do not experience these improvements in symptoms and might be considered non-responders.38 Studies using CMR to investigate the potential role of LV scar tissue in this phenomenon not only found a significant correlation between increased LGE burden and non-response to CRT, but also suggested a dose–response-type relationship that predicted this outcome.39,40 The greater the scar burden, the less likely patients are to respond. The quality of the scar is also important: patients with partial-thickness and, to a greater extent, full-thickness posterolateral LGE, have a lesser response to CRT and are at significantly greater risk of cardiovascular death and heart failure rehospitalisation than those without scarring in this region, see Figure 3.41,42 The potential to utilise CMR to guide optimal response to CRT was subsequently utilised in a study (n=559) where patients who had their LV lead deployed over areas of myocardium containing scar tissue had significantly higher risk death or hospitalisation than those who were paced away from scar tissue (HR 5.57; CI 3.40–9.14; p≤0.0001), see Figure 4.43
Advances in post processing techniques now allow tissue characterisation images to be fused with 3D whole-heart images that accurately depict the coronary sinus anatomy in relation to areas of scar tissue using data from the same CMR scan.44 This technology has the potential to allow pre-emptive prediction of whether patients will benefit from CRT implantation based on their individual anatomy.
Implantable Cardioverter-Defibrillator Implantation
Reduced left ventricular systolic function (LVEF ≤35 %) remains the sole arbiter in international guidelines for implantable cardioverter-defibrillator (ICD) therapy in heart failure patients.9,10 Paradoxically, 70–80 % of those who suffer sudden cardiac death (SCD) have an ejection fraction (EF) of >35 %45,46 and up to half of patients who currently receive an ICD never use it.47 The field has recently become even more controversial following the recent Danish Study to Assess the Efficacy of ICDs in Patients with Non-ischemic Systolic Heart Failure on Mortality (DANISH), which included 1,116 participants.48 In this very well conducted study, patients with a NICM and EF <35 % were randomised to ICD or no ICD and followed up for a mean period of 68 months. There was no difference in the primary outcome of death from any cause, although there was a reduction in sudden death. There was no CMR in this study and critics have argued that this may have shed light on those patients who could benefit from ICD. This does more to highlight the inadequacies of EF as a gatekeeper to ICDs and has been the driving force behind efforts to identify novel biomarkers, including CMR indices that accurately identify patients at increased risk of SCD. As scar tissue is a focus for the development of malignant ventricular arrhythmias in both ICM49 and NICM50, its detection and quantification by LGE has been strongly associated with arrythmogenic events in patients who fall both within and, more interestingly, outside the current ICD implantation guidelines.51
Following the results of DANISH, a recent study including 253 individuals set out to determine whether CRT with a defibrillator is superior to CRT with a pacemaker in NICM patients with or without focal LV midwall fibrosis (MWF) detected by LGE.52 As expected, MWF conferred an adverse prognosis, with a 3.75-fold higher risk of SCD. Only patients with MWF gained a benefit from a defibrillator over a pacemaker in terms of outcome, suggesting that scar detection on CMR could be an invaluable tool in guiding appropriate device therapy.
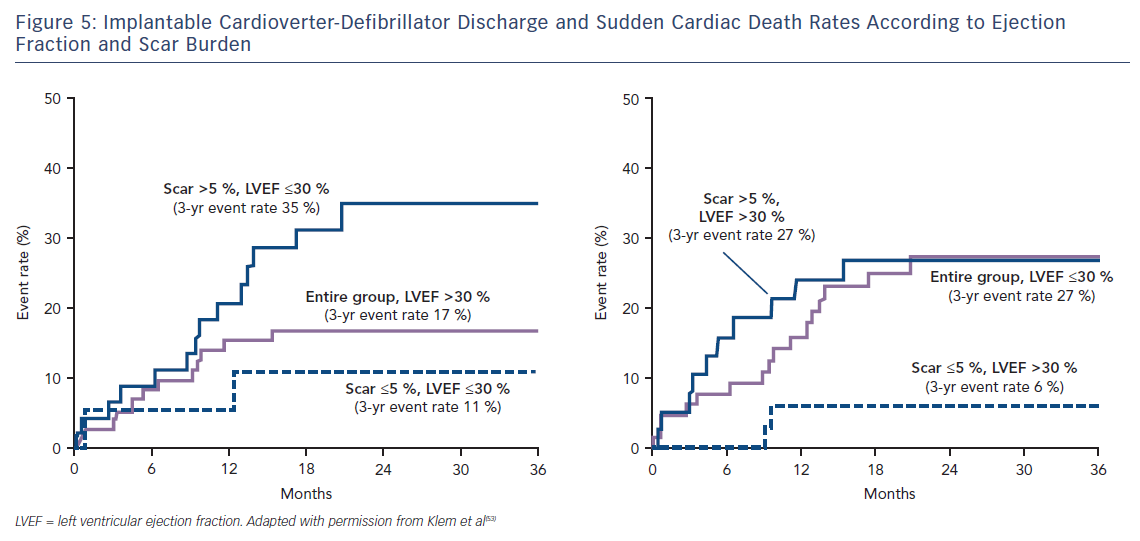
Klem et al. performed CMR in 137 individuals (half with reduced EF, half preserved EF and split approximately half ICM versus NICM) prior to implantation of an ICD. They found that, in contrast to the gradual increase in adverse incidents that was observed with worsening LVEF, there was a sharp step-up in death or ICD discharge with even a small amount of scar tissue (>5 % of the LV mass; HR 5.2; CI 2.0–13.3; p=0.0006).53 Other studies have confirmed this finding of a threshold effect of scar burden conferring a strong adverse prognostic effect.54–59 Patients with preserved EF and scarring on CMR have a similar event rate to those with EF <30 %; while patients with EF <30 % but no scar have a similar event rate to those with preserved EF, see Figure 5. This observation eloquently demonstrates that an EF threshold used to arbitrate ICD prescription will inevitably lead to unused implants in many patients with low EF and overlooked arrhythmic deaths in many patients with preserved EF.
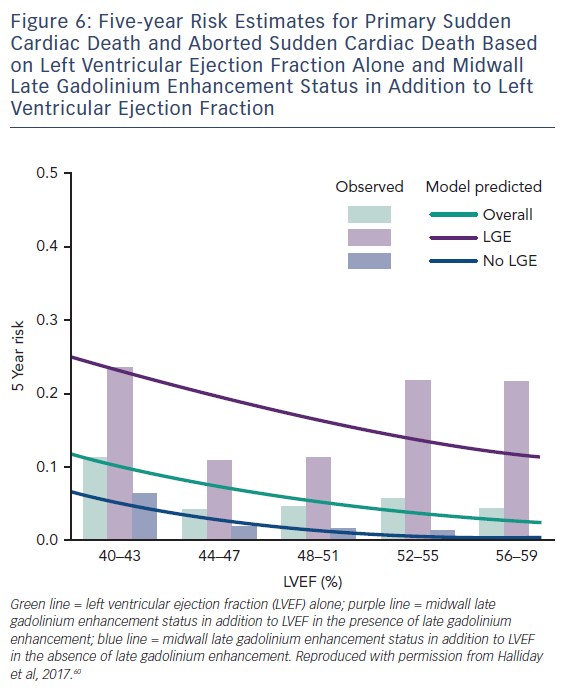
A more recent study including 399 participants with a median LVEF of 50 % followed up for a median of 54 months found a similar phenomenon in patients with NICM and preserved LV function. Midwall LGE was a significant independent predictor of SCD (HR 4.8; CI 1.7–13.8; p=0.003) and aborted SCD (HR 35.9; CI 4.8–271.4; p<0.001), independent of LVEF, see Figure 6.60
Scar heterogeneity has also been shown to have a significant influence on the development of ventricular arrhythmias. Border zone (BZ) scar, defined as areas with a LGE signal intensity of <50 % of the infarct core zone (CZ), is well known to confer a more significant risk of developing arrythmogenic endpoints than total scar burden alone.61–63 More recently Acosta et al. used 3D colour-coded LGE signal-intensity maps to accurately quantify total scar mass, CZ mass, BZ mass and BZ channel mass (defining a corridor of BZ connecting two areas of normal myocardium flowing between two CZs or between a CZ and a valve annulus) in 219 patients undergoing CRT implantation (defibrillator 71 %).64 Patients had a mean LVEF of 26 % and were followed up for a median of 36 months. Although all scar parameters correlated with a significantly increased risk of ICD therapy or SCD, BZ mass (HR 1.06; CI 1.04–1.08) and BZ channel mass (HR 1.2; CI 1.10–1.32) were the strongest predictors of these endpoints. Interestingly, regardless of aetiology, patients with scar tissue but without BZ channels did not receive any ICD therapy or experience SCD (100 % negative predictive value). LVEF was not identified as an independent predictor of the primary endpoint.
It therefore seems that quantification and characterisation of scar tissue using LGE has a significant influence on adverse outcomes related to arrhythmias over and above that yielded from EF. This suggests that these scar parameters may be a better way to identify patients who would benefit from implantation of an ICD rather than the single parameter of EF. These fascinating observations have provided the impetus for eagerly anticipated randomised control trials such as Defibrillators To Reduce Risk by Magnetic ResoNance Imaging Evaluation (DETERMINE, NCT00487279) and Cardiac Magnetic Resonance GUIDEd Management of Mild-moderate Left Ventricular Systolic Dysfunction (CMR-Guide, NCT01918215), which aim to establish whether ICD therapy improves the prognosis of patients with mild-to-moderate LV systolic dysfunction (LVEF >35–50 %) and LGE with ICM and NICM, respectively.
The LGE technique has provided new pathophysiological insights across the spectrum of cardiovascular disease and is probably the single most important development since CMR became a clinical tool in the last millennium. It has certainly been the driving force behind the huge expansion in the utilisation of the technique over the past 2 decades. However, LGE does have some important limitations. Despite LGE being highly accurate at identifying focal fibrosis, its reliance on relative signal intensity differences and the intentional nulling of “normal” myocardium means it cannot be utilised to identify diffuse myocardial fibrosis (DMF). A heart could be 50 % scar tissue, but if it is equally distributed throughout the myocardium the LGE technique would belie this fundamental pathology and the clinical report may simply read “no scar”. This problem also means that you cannot use the signal intensity from one scan as a comparator against another – either within the same patient over time or across different patients. In addition, one can only see the “tip of the iceberg”, as a threshold of fibrosis (perhaps as much as 15 %) needs to be crossed before it is detectable.65 Finally, within an area of “scarring” there are islands of intact myocytes and within areas of “normal” myocardium there may be microscopic pockets of fibrosis. These limitations, together with a lack of consensus regarding the optimal method for LGE quantification,66,67 have led to the development of T1 mapping sequences that have the potential to overcome many of these limitations.
T1 Mapping
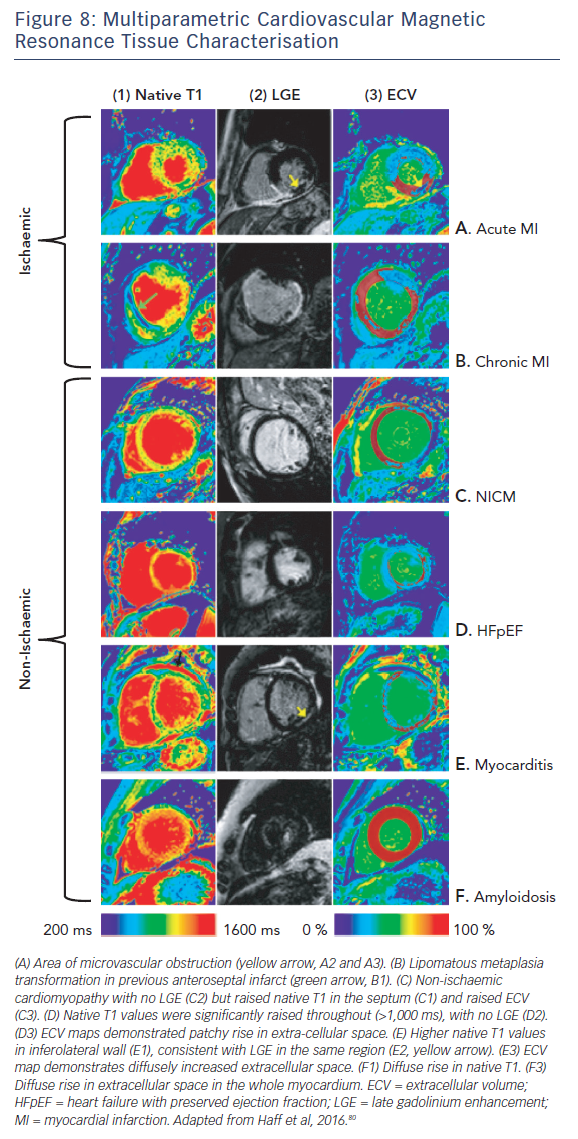
Essentially, the method uses a robust imaging sequence to quantify the T1 time; the readout of this being a colour image. The colour of each pixel represents the T1 time in ms on a scale. The T1 of tissues is mostly influenced by their water and fat content. Fatty tissues have a very low T1 and are represented in one colour; tissues containing water, which is found in scars containing collagen for example, have a long T1 represented in another colour. The technique is so sensitive that it has been able to detect a difference between healthy males and healthy females of around 20 ms.68 This is a completely novel and largely unexplained phenomenon. With this sensitivity, images taken in one patient can be used to directly track disease progression/regression over time (provided that the disease trajectory affects the water/fat content of the myocardium in one direction or the other). T1 maps acquired before and after Gd enable us to non-invasively derive the extracellular volume (ECV) in a highly reproducible manner that has been well validated against histological analysis.69–71 Colour maps can be generated that display each pixel as the ECV expressed as a percentage (normal being approximately 20 %). In most diseases, elevations in ECV represent collagen/scar (and correspondingly DMF). T1-mapping techniques allow this to be seen within areas of infarction/non-ischaemic scar and also in remote/”normal” myocardium. In cardiac amyloid the ECV represents the protein burden in the tissue, and although this is an incredibly important parameter in prognostication72,73 it is beyond the scope of this article and is reviewed elsewhere.74 There are several excellent and very recent review articles that very eloquently describe the physics and the strengths of this new method as well as some of the ongoing controversies and difficulties it faces.75–78 T1-mapping techniques are still an area of avid research but we highlight here how they are already finding utility in diagnostics and prognostication with reference to heart failure.
Heart Failure Aetiology
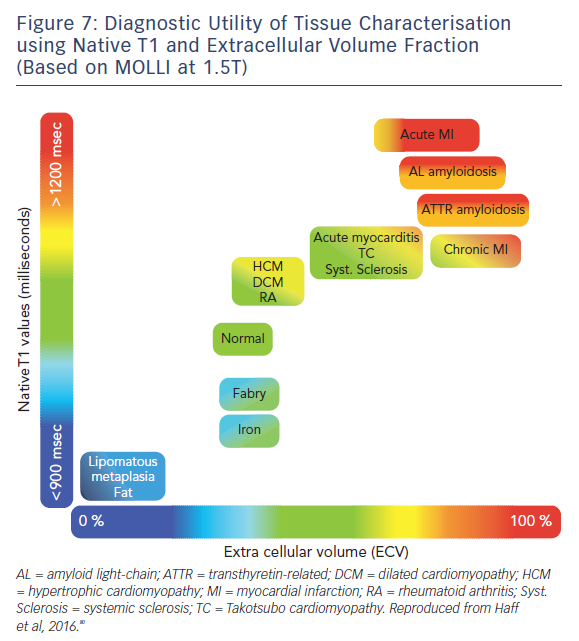
The ability of T1-mapping techniques to determine DMF in vivo has greatly augmented the diagnostic capabilities of CMR and provided new insight into the pathophysiological processes that ultimately culminate in the development of heart failure in a wide range of diseases, see Figures 7 and 8.79,80 Automated post processing software packages81 and synthetic ECV calculation methods82 have swiftly transitioned these imaging sequences from theoretical research tools to standardised protocols used in some centres in everyday clinical practice. Some caution is advised in their routine application: the absolute values for native T1 depend greatly on field strength, pulse sequence, scanner manufacturer and the rules of measurement.83 Before clinical implementation, local reference ranges should be established.
Adverse Outcomes
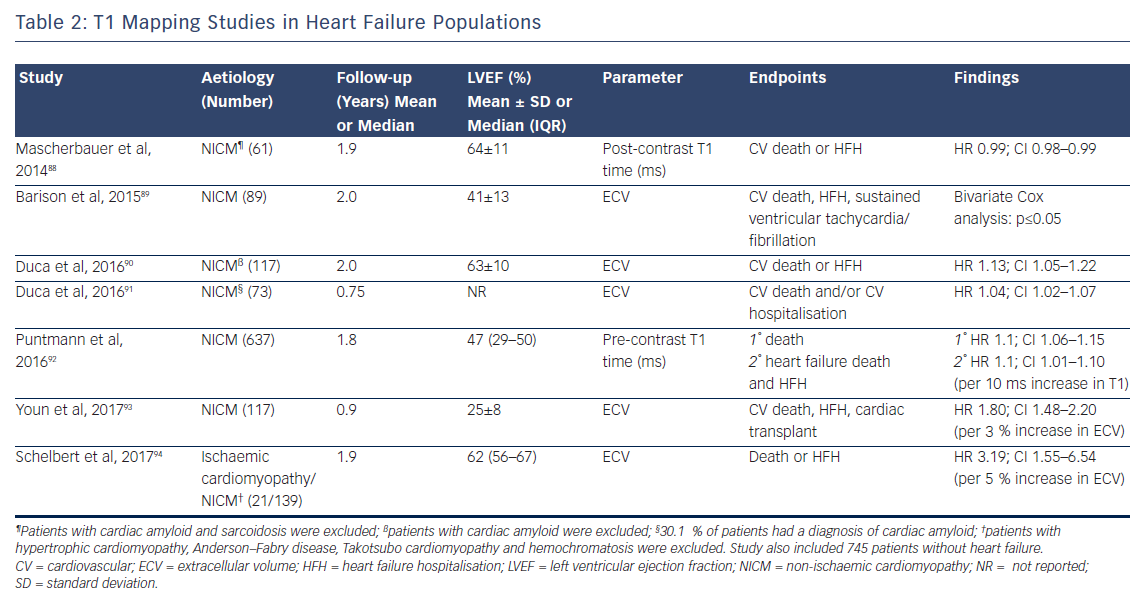
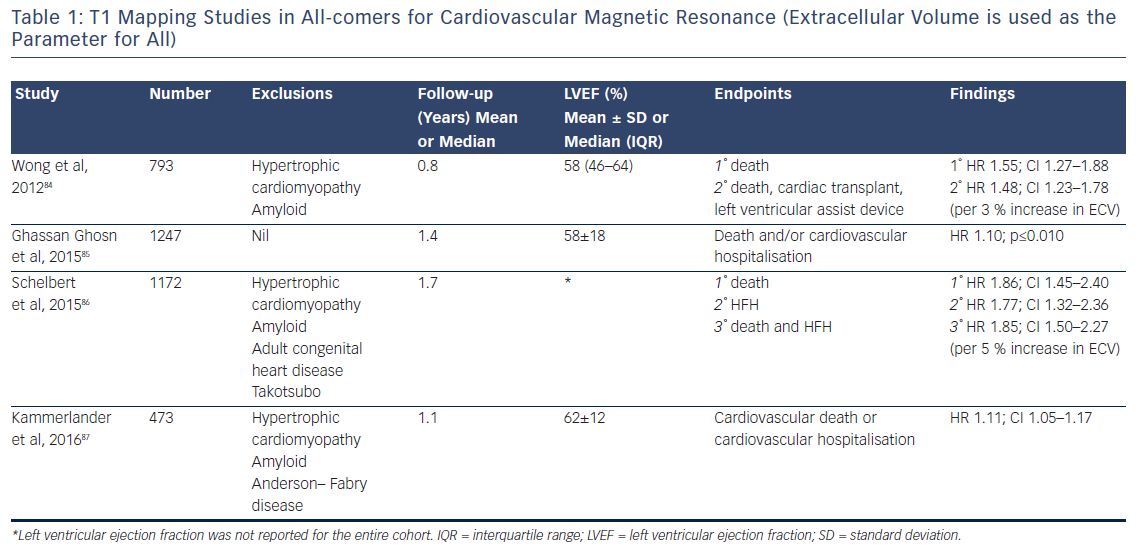
The past 5 years have seen a number of large studies investigating the prognostic role of T1 mapping in both all-comers referred for CMR, see Table 1, and in patients with heart failure, see Table 2.
Although the majority of this research (which includes over 6,000 patients and nearly 9,000 patient years of follow-up) is prospective in design, potentially leading to selection bias in the patient cohort, the fascinating and consistent finding is that T1 and ECV are independently associated with poor outcome in a dose-dependent fashion, independently of EF, focal scar burden (LGE) or aetiology.
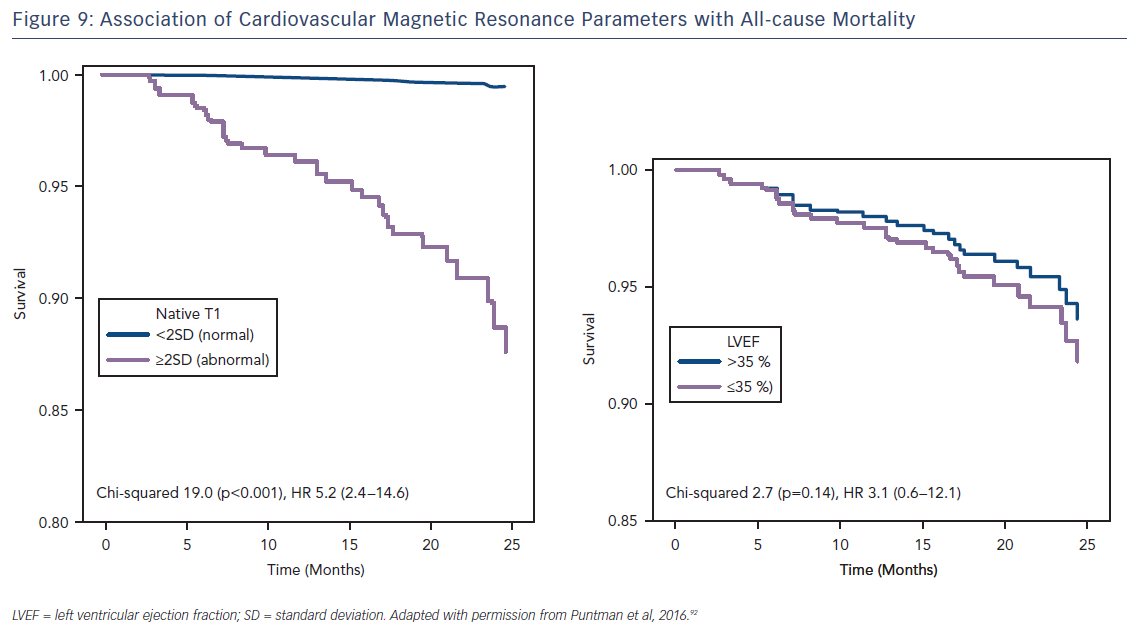
The ability to accurately quantify DMF using these techniques allows the relative risk of an adverse event to be estimated per unit change in these parameters. Schelbert et al. found that a 3 % rise in ECV in heart failure with preserved EF patients with both ICM and NICM (n=160, median LVEF of 62 % and mean follow-up of 1.9 years) correlated with a three-fold increase in risk of death or heart failure hospitalisation.84 Puntman et al., who followed 637 patients with a median LVEF of 47 % for an average of 1.8 years, found that a 10-ms increase in native T1 time is associated with a 10 % increased risk of the same endpoints in patients with NICM.85 Consider how tiny this difference is, as 10 ms is half the difference identified between healthy males and females. Yet this parameter is a more sensitive biomarker of adverse events than LVEF (HR 5.2 versus 3.1), see Figure 9.
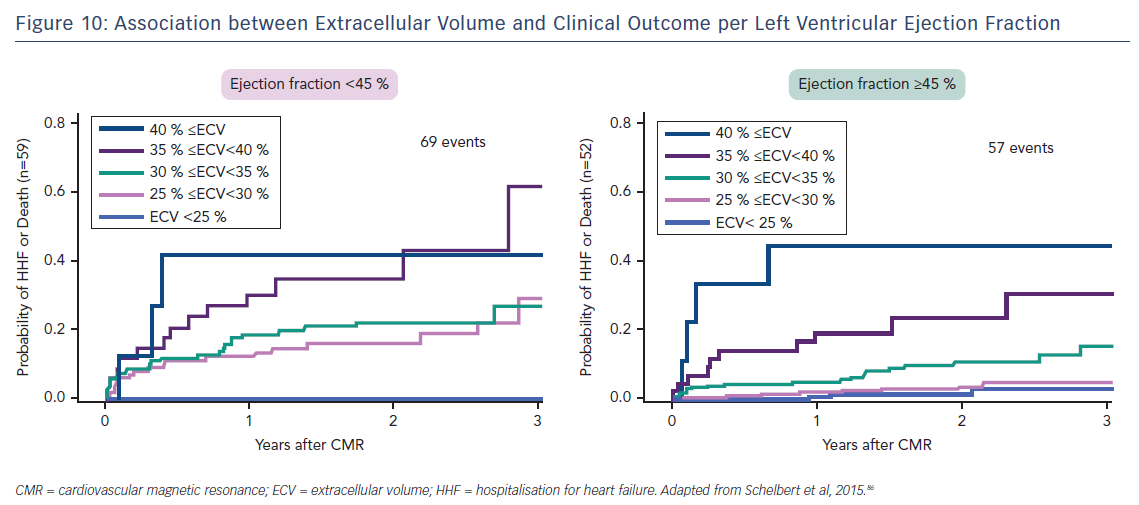
Indeed, the prognostic predictive value of these methods, over and above LVEF – the current benchmark in heart failure – was elegantly demonstrated by Schelbert et al.86 The authors studied 1,172 individuals for a mean 1.7 years and found that ECV was significantly associated with an increased risk of heart failure hospitalisation and death in a univariate Cox regression model (p<0.05 for all) whether LVEF was reduced (<45 %) or preserved (>45 %), see Figure 10.86 The graph shows a dose–response relationship, hinting at an aetiological link between ECV expansion and adverse outcome.
The study by Wong et al.95 including 1,176 participants followed up for a median of 1.3 years found that ECV was significantly higher in patients with diabetes than in those without (30.2 % [interquartile range 26.9–32.7 %] versus 28.1 % [interquartile range 25.9–31.0 %], respectively; p≤0.001). This again highlights the technique’s exceptional sensitivity. Moreover, within the population, a 3 % rise in ECV correlated with a 52 % increased risk of death and/or heart failure hospitalisation (HR 1.52; 95 % CI 1.21–1.89).95
Response to Medical Therapy
Invasive myocardial tissue sampling has shown that DMF can be reversed by a number of first-line heart failure medications (lisinopril,96 perindopril,97 losartan98 and spironolactone99). Since T1 mapping is sensitive to these changes, it has the potential to be the first accurate non-invasive method of monitoring reduction in DMF as a response to medical therapy. If this is observed, it may help to explain why some patients with apparent severe heart failure go on to have a good prognosis and recovery of LV function. Indeed, an early study investigating the impact of treating post myocardial infarction patients with Omega-3 fatty acids (n=358) successfully used T1 mapping to accurately quantify and monitor DMF,100 highlighting this as a potentially viable method of establishing patients on optimal medical therapy based on their histological parameters.
One in 10 patients treated with anthracycline chemotherapy develop cardiotoxicity,101 which has been shown to have a significant prognostic implication.102 As early diagnosis and treatment of this complication with routine pharmaceutical therapy for heart failure reverses adverse remodelling and reduces subsequent cardiovascular adverse events,101,103 the identification of individuals who are at increased risk of this complication is of critical importance. A recent study104 identified patients previously treated with anthracycline chemotherapy as having significantly increased ECV compared with controls, suggesting that T1-mapping techniques may have a role to play as novel risk stratification biomarkers prior to and during treatment with anthracycline agents. Indeed, ongoing clinical trials in this area (NCT01719562) aim to provide the evidence required to increase access to CMR screening before chemotherapy, which has been identified as one of the major factors limiting its use as a diagnostic imaging tool in this cohort.105
Response to Cardiac Resynchronisation Therapy
The only study to date that has investigated the potential correlation between contrast-enhanced CMR-derived myocardial depressant factor and response to CRT showed that ECV calculated from a single region of interest in the septum of 48 patients (28 with ICM and 21 with NIDCM) correlated with response to biventricular pacing, but this effect did not hold up on multivariate analysis.106 As studies using multi-segmental analysis of the whole myocardium have identified that regional variation in ECV is significantly related to intra-ventricular dyssynchrony irrespective of EF,107 further clinical trials utilising whole-heart T1 maps to further explore this relationship are warranted.
Implantable Cardioverter-Defibrillator Implantations
DMF has been shown to be pro-arrythmogenic due to its disruptive effect on electrical propagation between myocytes.108,109 DMF identification and quantification using T1 mapping therefore has potential as a risk biomarker for malignant arrhythmias and subsequent ICD implantation in heart failure patients.
One single-centre study followed-up 138 patients (71 with ICM and 59 with NICM) who underwent CMR prior to ICD implantation for a mean of 1.2 years. It was found that native T1 times were an independent predictor of appropriate ICD therapy and ventricular arrhythmias according to univariate (HR 1.06; CI 1.01–1.11; p=0.021 per 10 ms increase in T1 time) and multivariate (HR 1.10; CI 1.04–1.16; p=0.01 per 10 ms increase in T1 time) analysis.110 Further research in this area is clearly needed.
T2 Techniques
T2-weighted imaging allows the visualisation of myocardial oedema due to the accumulation of water prolonging the T2 relaxation time; it enables the decay of transverse magnetisation to be measured. While “conventional” T2 sequences such as short tau inversion recovery (T2 STIR) can generate images that enable qualitative assessment of myocardial oedema in a variety of acute cardiomyopathies,111 T2-mapping techniques allow the extent of these inflammatory changes to be accuracy quantified in a similar way to T1 maps.112,113 Indeed, there is a growing body of evidence highlighting the diagnostic role of T2 mapping in acute cardiac conditions such as myocardial infarction,114 myocarditis,115,116 stress-induced (Takotsubo) cardiomyopathy117,118 and acute transplant rejection.119,120 However, to date no prognostic evidence derived from these techniques has been reported in the heart failure population and further research in this area of CMR is warranted.
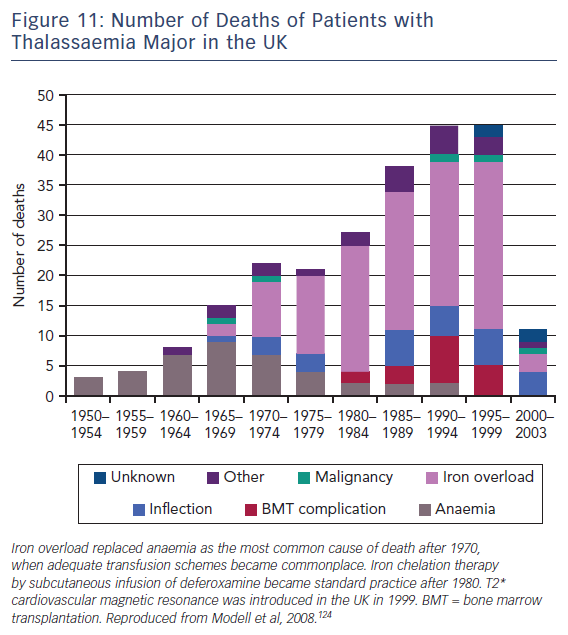
T2-Star (T2*) is a relaxation parameter that inversely relates to the iron stores in any tissue and allows accurate, reproducible quantification of myocardial iron deposition.121,122 Since its introduction into clinical practice in 1999, this CMR technique has been successfully utilised as a screening tool in transfusion-dependent beta thalassemia patients to identify those with increased cardiac iron deposition. These patients are at significantly increased risk of cardiac complications such as heart failure and malignant arrhythmias.123 Early initiation of chelation therapy in these individuals has had an extraordinary impact on the long-term prognosis of this condition, with a 71 % reduction in the annual death rate from iron overload since 2000, see Figure 11.124 Interestingly, T1 mapping has potential in this field, since myocardial iron also shortens intrinsic T1 times. In early studies, T1 mapping appears to be more sensitive than T2 measurement,125,126 although its role in guiding therapy is yet to be established.
Conclusion
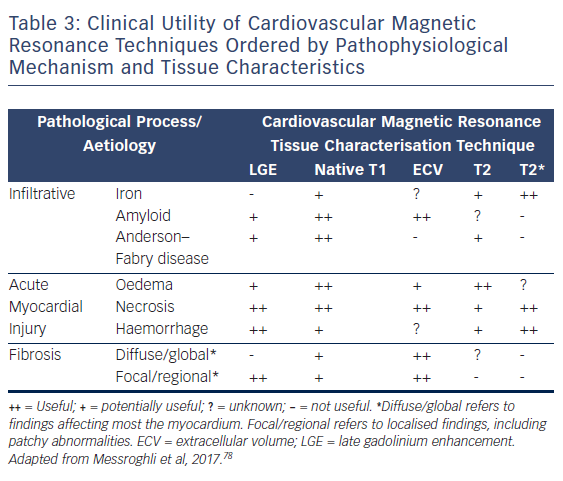
CMR is firmly established as the gold standard diagnostic imaging investigation in heart failure due to its unparalleled capability to accurately assess cardiac function and anatomy with excellent reproducibility and its novel ability to non-invasively identify specific aetiological processes, see Table 3.
There is a growing body of prognostic evidence using tissue characterisation techniques that suggests real potential as a viable risk-stratification biomarker and a precise means of tracking response to therapy. However, the techniques are continuing to evolve and undergo further refinement as summarised by the Society for Cardiovascular Magnetic Resonance in their recently-published second consensus statement regarding CMR parametric mapping.78 We currently lack the wealth of data required for them to become routine clinical tools. We need a clearer understanding of the interrelation between native T1 and ECV. How do disease processes exert differential influence and what is the impact of that? The ongoing issue of variation in quantification methods must be solved using the standardisation of normalised reference ranges between vendors. Efforts are already underway to achieve this.127 With randomised trials, such as DETERMINE and CMR-GUIDE underway and a further 37 T1-mapping studies currently registered on www.clinicaltrials.gov, the evidence required to address these and other issues are in the pipeline. The reliance on EF as the sole arbiter for advanced therapies such as defibrillator implantation must end. As we move into the next decade, precision medicine, which is already finding application in several specialities, such as oncology, endocrinology and microbiology, will become more commonplace. CMR tissue characterisation techniques continue to mature and it seems likely they will play a leading role in the development of precision heart failure care. n


